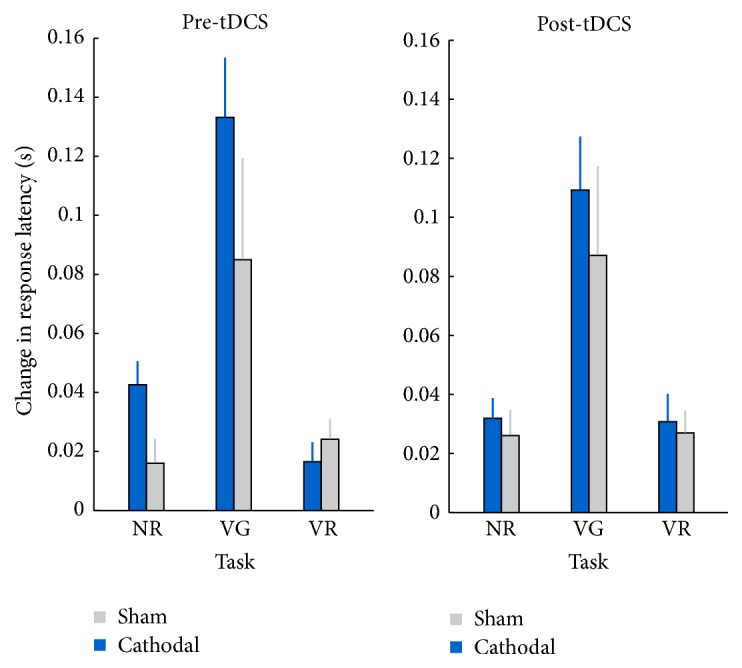
Figure 3.

Results for the learning variable, calculated by subtracting the verbal response times (s) in block 5 from the verbal response times (s) in block 1. This difference is presented for each task, before and after tDCS. Error bars represent the standard error of the mean (SEM).
