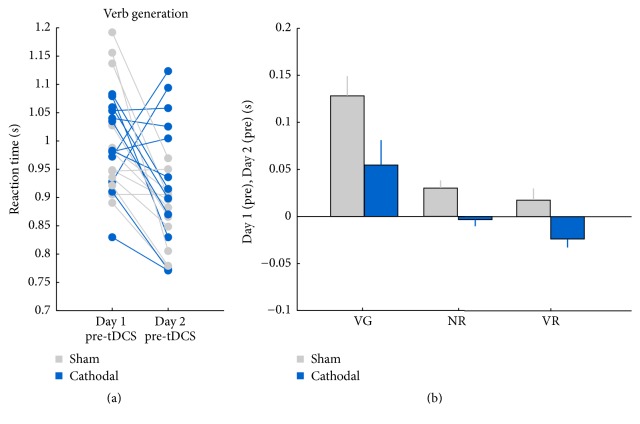
Figure 4.
Results for the long term effects. (a) The individual verbal response times on the verb generation task, for visit 1 and visit 2. (b) The mean verbal response times for each task, subtracting performance in the second visit from the first visit. Error bars represent the standard error of the mean (SEM).

