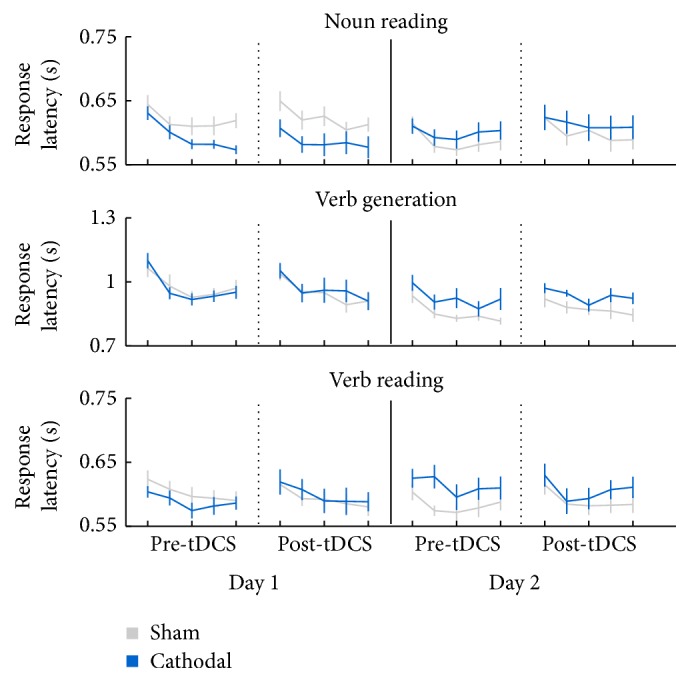
Figure 5.

Verbal responses times (s) across blocks 1–5 and for each task, for the time points pre-tDCS visit 1, post-tDCS visit 1, pre-tDCS visit 2, and post-tDCS visit 2. Blue represents the group starting with the cathodal condition in the first visit and grey represents the group starting with the sham condition in the first visit. Error bars represent the standard error of the mean (SEM).
