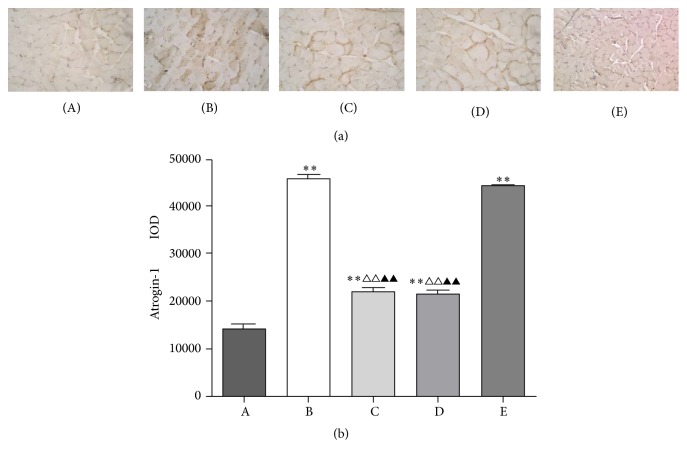
Figure 4.
Immunohistochemistry of gastrocnemii from normal group (A), model control group (B), BYJD treatment group (C), BYJD prevention group (D), and MPA group (E), where protein expressions are shown for Atrogin-1. (b) Values are expressed as mean ± SD of eight mice. ∗∗P < 0.01 compared with normal control group; △△P < 0.01 compared with the model control group; ▲▲P < 0.01 compared with the MPA group.

