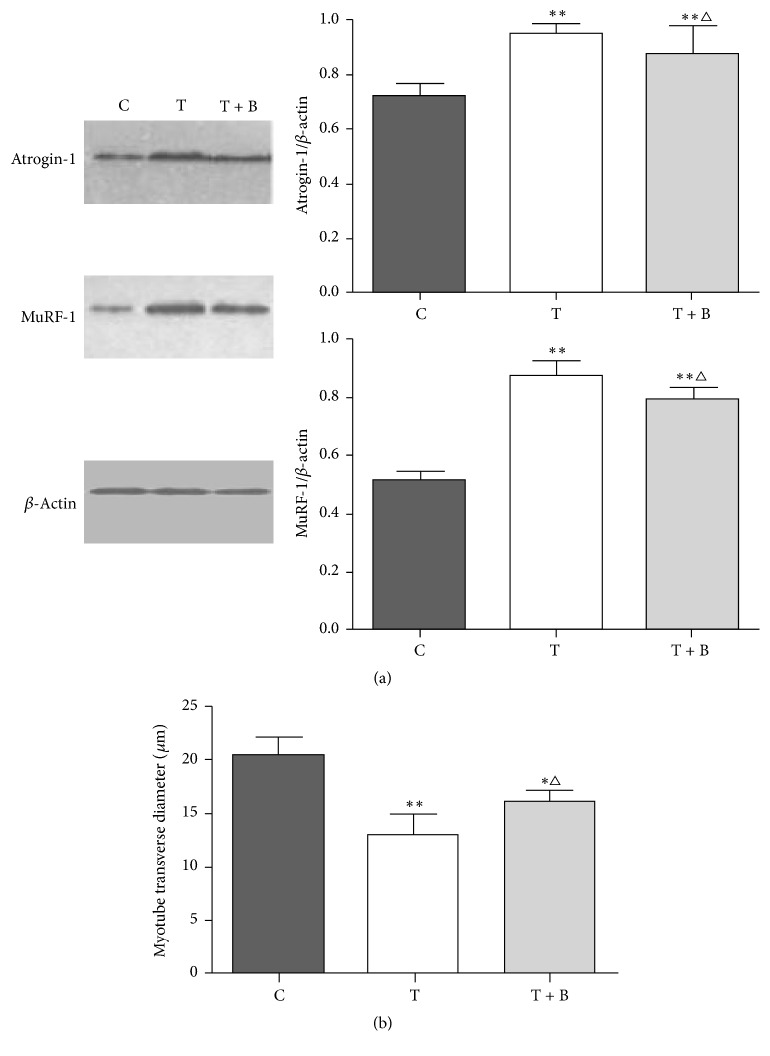
Figure 6.
(a) Western blot analysis for expressions of Atrogin-1, MuRF-1, and β-actin in C2C12 myotubes normal control group (C), TNF-α intervention group (T), and BYJD decoction medicated serum group (T + B). The graph represents relative densitometric intensity of each band normalized to β-actin. (b) Changes of myotube transverse diameter in normal control group (C), TNF-α intervention group (T), and BYJD decoction medicated serum group (T + B). Values are expressed as mean ± SD of eight mice. ∗P < 0.05 and ∗∗P < 0.01, compared with normal control group; △P < 0.05 compared with the TNF-α intervention group.

