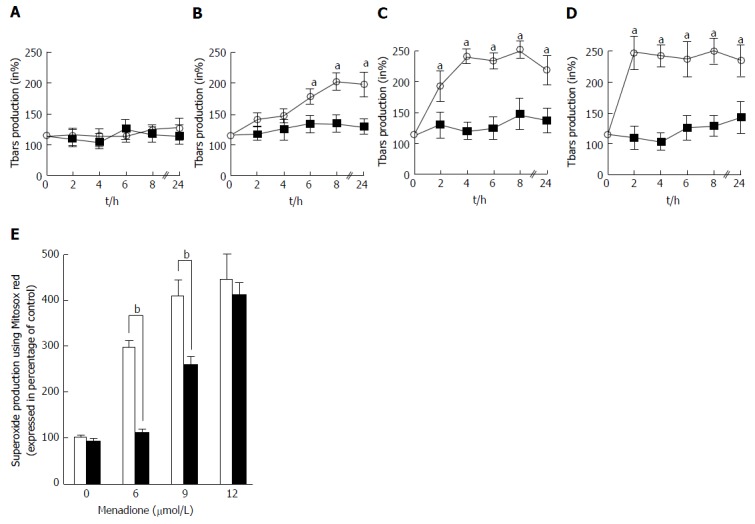
Figure 3.

Characterization of reactive oxygen species production. A-D: Tbars production was determined in C2C12 cells in the presence of various amounts of menadione from 1 to 24 h. Results were expressed in percentage of the control cell Tbars production. Tbars production was analyzed in the presence of 0 (A), 6 (B), 9 (C) and 12 μmol/L (D) of menadione in control cells (empty circles and dashed line) and in cells pre-treated with 500 μmol/L of carnitine (black squares and full line). An asterisk on top of a symbol indicates a significant difference (P < 0.05); E: Superoxide anion production at the mitochondrial level on menadione-treated C2C12 cells with MitoSoxRed. C2C12 cells were either untreated (white histogram) or pretreated with 500 μmol/L of L-carnitine (black histogram) and incubated for 24 h with desired concentration of menadione (from 0 to 12 μmol/L). MitoSoxRed (MSR) is a cell permeable dye that is targeted to the mitochondria, it is oxidized by superoxide and exhibit red fluorescence. Superoxide production was measured by cytometry after staining with MSR. Results are presented as the mean value ± SD. A star on the top of two histograms indicates statistical difference (P < 0.005) between these two values (Untreated vs L-carnitine treated cells).
