
Figure 2.
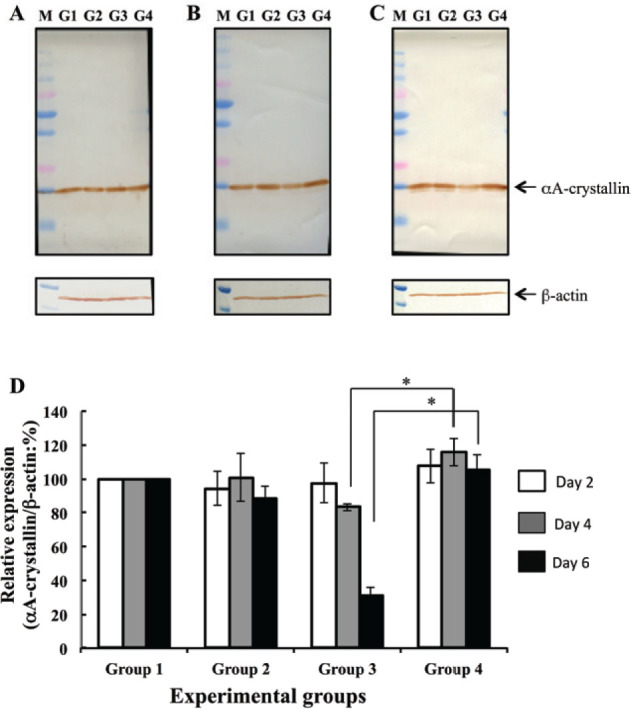
Western blot analyses to determine αA-crystallin levels. aA-crystallin levels were analyzed 2 days (A), 4 days (B), and 6 days (C) following selenite or placebo administration. b-actin was used as an internal control. Lane G1 was loaded water-soluble fraction of G1 lens (no selenite and no hesperetin treatment). Lane G2 was loaded water-soluble fraction of G2 lens (no selenite and hesperetin treatment). Lane G3 was loaded water-soluble fraction of G3 lens (selenite treatment and no hesperetin treatment). Lane G4 was loaded water-soluble fraction of G4 lens (selenite and hesperetin treatment). Lane M shows molecular weight markers. (D) Bar diagraph of aA-crystallin levels, as determined with densitometry-measured band intensity, at each time point examined. All values are relative to that measured in group G1. Data represent mean values and error bars represent one S.E. * indicates P < 0.05 for significant differences.