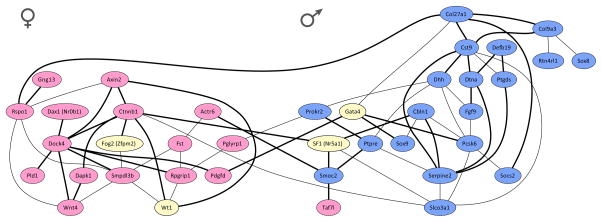
Figure 2.
Evidence for a transcriptional tug-of-war underlying sex determination. A coexpression network was estimated for a subset of 40 genes quantified in 68 XY gonad samples from a mixed F2 intercross of B6 and 129S1. ‘Male’ genes that are enriched in XY gonads at E11.5 are highlighted in blue, whereas ‘female’-enriched genes are highlighted in pink, and genes with known roles in sex determination that are not expressed in a sexually-dimorphic pattern at E11.5 are highlighted in yellow. Thick black edges represent more robust coexpression relationships (partial correlation coefficient ≥ 0.33), while thinner edges are less robust but still significant (partial correlation coefficient ≥ 0.25).
Permission pending from Cold Spring Harbor Press

