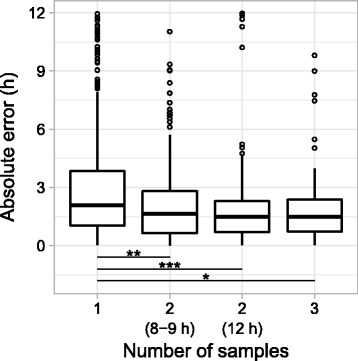
Fig. 4.

Predicting CT using various numbers of control samples from the same individual. Boxplots of absolute error from tenfold cross-validation. From left to right, the numbers of groups (one prediction per group) were 498, 198, 200, and 121. Levels of statistical significance (Wilcoxon rank-sum test): * P = 2.5 × 10⁻⁴, ** P = 1.9 × 10⁻⁵, *** P = 5.9 × 10⁻⁷. Other differences were not statistically significant
