Fig. 3.

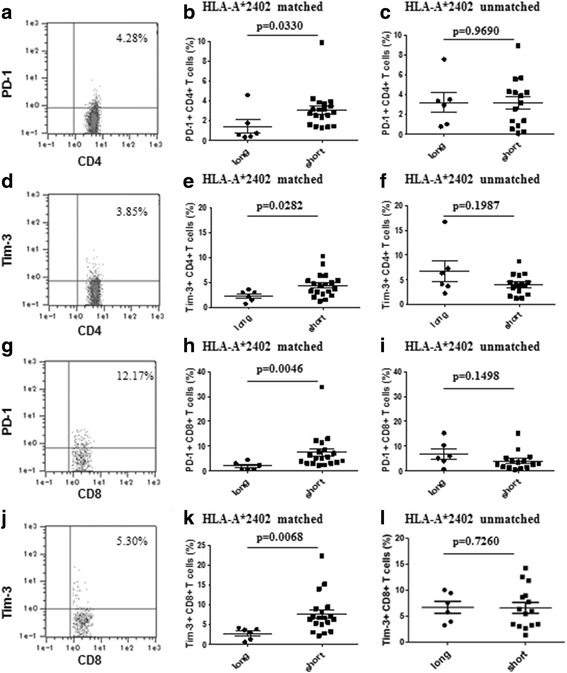
Expression of biomarkers after 3rd cycle treatment. PD-1 and Tim-3 expression on CD4+ and CD8+ T cells obtained from patients in the HLA-A*2402-matched group and the HLA-A*2402-unmatched group after the 3rd cycle of treatment. (a) Analysis for PD-1 expression in the CD4+ lymphocyte gate. (b) In the HLA-A*2402-matched group, the percentage of PD-1+ CD4+ T cells in the patients of the short-survival group (n = 19) was significantly higher than in the patients of the long-survival group (n = 6). (d) Analysis for Tim-3 expression in the CD4+ lymphocyte gate. (e) In the HLA-A*2402-matched group, the percentage of Tim-3+ CD4+ T cells in the patients of the short-survival group was significantly higher than in the patients of the long-survival group. (g) Analysis for PD-1 expression in the CD8+ lymphocyte gate. (h) In the HLA-A*2402-matched group, the percentage of PD-1+ CD8+ T cells in the patients of the short-survival group was significantly higher than in the patients of the long-survival group. (j) Analysis for Tim-3 expression in the CD8+ lymphocyte gate. (k) In the HLA-A*2402-matched group, the percentage of Tim-3+ CD8+ T cells in the patients of the short-survival group was significantly higher than in the patients of the long-survival group (p = 0.0068). (c), (f), (i), (l) In the HLA-A*2402-unmatched group, there was no difference in the percentages of PD-1+ and Tim-3+ CD4+ or CD8+ T cells between the patients with a long survival (n = 6) and the patients with a short survival (n = 15)
