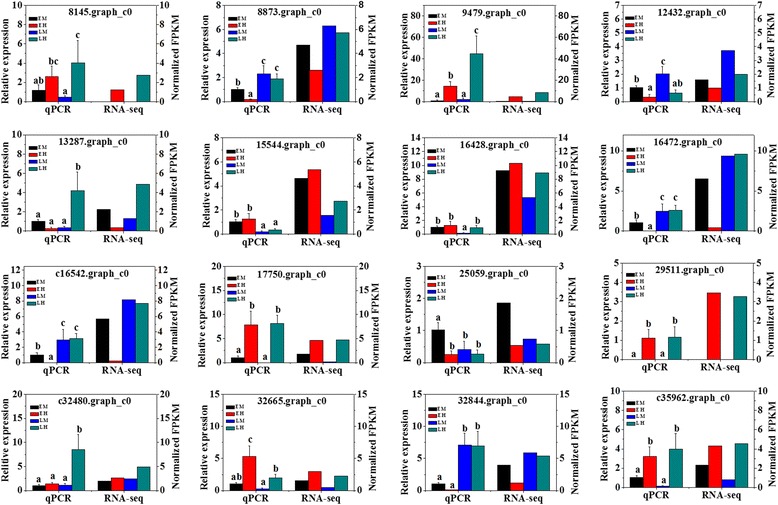
Fig. 8.

Validation of 16 randomly selected differentially expressed genes (DEGs) derived from RNA-seq using Real-time quantitative RT-PCR. Quantitative gene expression data represented as the mean ± SD are shown on the left. The EF1α and UBQ were used as reference genes. Statistically significant differences of relative expression derived from one-way ANOVA at the level of P < 0.05 were marked as different lowercase letters. The normalized FPKM, transformed by log2 (1+ FPKM), were indicated on the right
