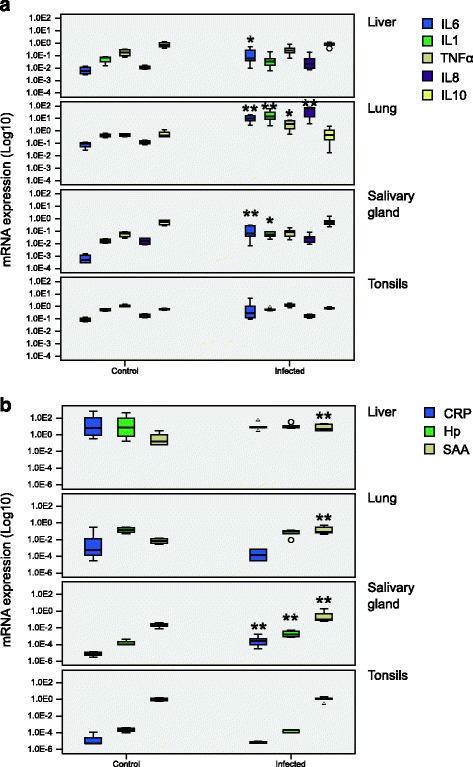
Fig. 3.

Cytokine and acute phase protein mRNA analyses. mRNA expression of (a) cytokines IL-6, IL-1, TNF-α, IL-8, IL-10 and (b) acute phase proteins CRP, C-Reactive Protein; Hp, Haptoglobin and SAA, Serum Amyloid A in different tissues of control (n = 4) and infected (n = 6) animals. Box-plots show median (line within the box), 25th and the 75th percentiles (box), 1.5 times the interquartile range (whiskers) and outliers (circles and triangles). The results were normalised to reference genes (Actin and Cyclophilin A) and to the internal standard. *p ≤ 0.05, **p ≤ 0.01
