
Fig. 3.
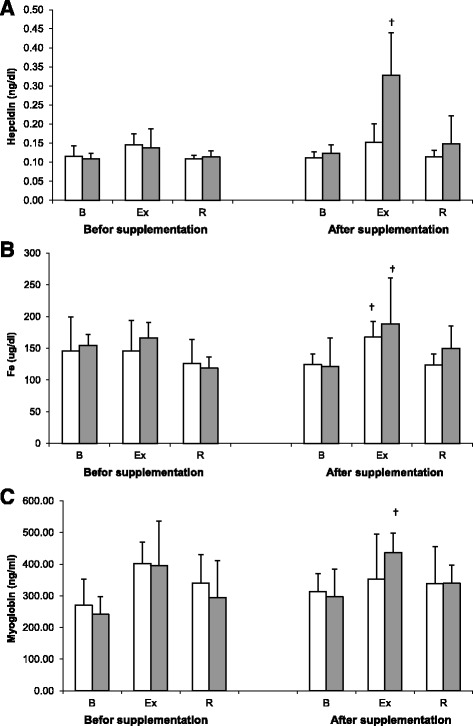
Changes in serum levels of hepcidin (a), iron (b), and myoglobin (c) levels during exercise tests performed before and after the supplementation (mean ± SD). Note. □ - SUPL = supplemented group;  − PLA = placebo group; B = baseline; Ex = immediately after the exercise; R = after a 1-day recovery; † − significantly different compared to baseline level