
Fig. 4.
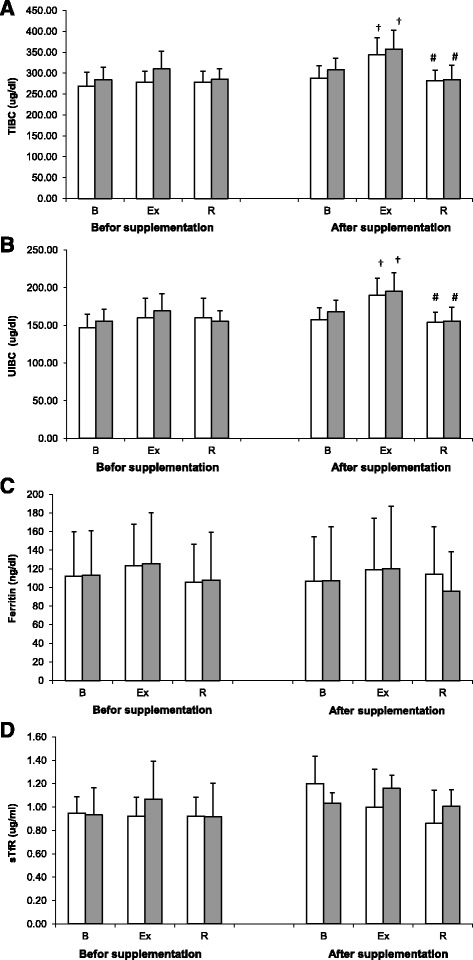
Changes TIBC (a), UIBC (b), ferritin (c) and sTfR (d) levels during exercise tests performed before and after the supplementation (mean ± SD). Note. TIBC = total iron-binding capacity; UIBC = unsaturated iron-binding capacity; sTfR = soluble transferrin receptor - □ SUPL = supplemented group;  − PLA = placebo group; B = baseline; Ex = immediately after the exercise; R = after a 1-day recovery; † − significantly different compared to baseline level; # -significantly different compared to post-exercise level