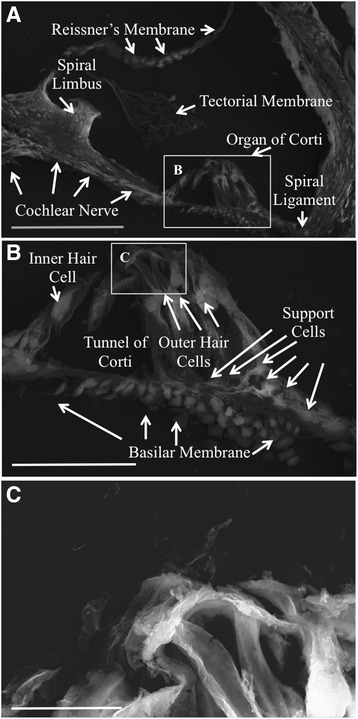
Fig. 1.

Scanning electron microscopy images of native mouse cochlea. The Everhart-Thornley detector (ETD) was used for imaging. In panel a, all the major components housed in the cochlear duct are labeled and present. Panel b, represents the inset in panel a, which magnifies the organ of Corti. Panel c represents the inset in panel b, which is a magnification of the outer hair cells. Panel a scale bar = 100 μm. Panel b scale bar = 40 μm. Panel c scale bar = 10 μm
