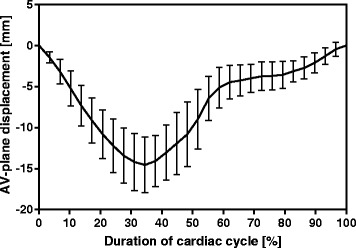
Fig. 2.

Span of prediction curve. The solid black line shows the prediction curve of the septum point in the 4-chamber view, obtained as the mean of the manually measured atrioventricular plane displacement (AVPD) of all subjects in the training set (n = 40). The bars marks ± 2SD of 10.000 randomly generated AVPD curves using the five most significant principal component analysis (PCA) eigenvectors multiplied with weights within ± 2SD of the weights calculated from manual measurements, illustrating the span of the prediction curve
