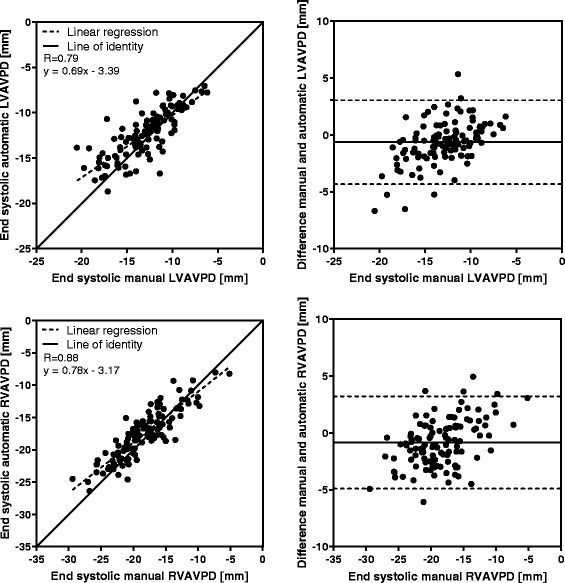
Fig. 5.

Correlation and bias in the end systolic timeframe for automatic tracking compared to manual measurements. Scatter plot of atrioventricular plane displacement (AVPD) at end systole in mm (left panel) and modified Bland-Altman plot of AVPD at end systole in mm (right panel) for the automatic tracking against manual measurements in n = 113 subjects. Top row shows results for the left ventricle (LVAVPD), and bottom row shows the results for the right ventricle (RVAVPD). The identity line is shown as a solid line in the scatter plots, and linear regression as a dashed line. A more negative AVPD correspond to a larger displacement. In the Bland-Altman plots the mean bias is shown as a solid line with limits of agreement (±2SD) as dashed lines. Correlation R value was 0.79 for the left ventricle, and 0.88 for the right ventricle. For the left ventricle, mean bias was −0.6 mm with limits of agreement between −4.3 and 3.1 mm. For the right ventricle, mean bias was −0.8 mm with limits of agreement between −4.9 and 3.3 mm
