
Figure 10.
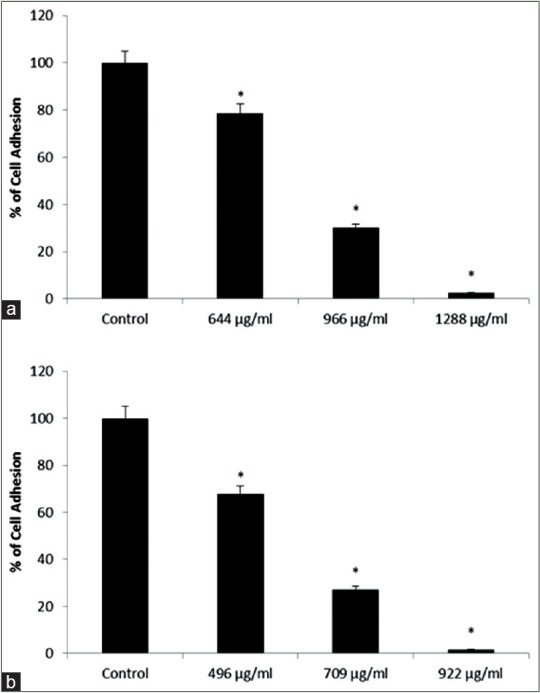
(a and b) Indicate mean cellular attachment percentage in MCF-7 and MDA-MB-468 cell lines, respectively, compared with the control group at different concentrations of chamomile extract. *Indicates a significant difference at the level of P < 0.05 compared with control