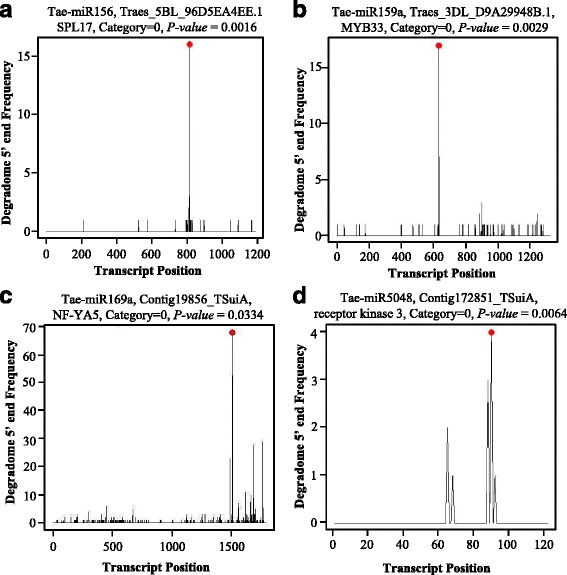
Fig. 4.

Target plots (T-plots) of miR156 (a), miR159 (b), miR169 (c), and miR5028 (d) characterized by degradome sequencing. The abundance of the signature tags was plotted along the indicated transcript. The red dots indicate the predicted cleavage sites on the x axis; the black line indicates the signatures produced by miRNA-directed cleavage
