
Fig. 3.
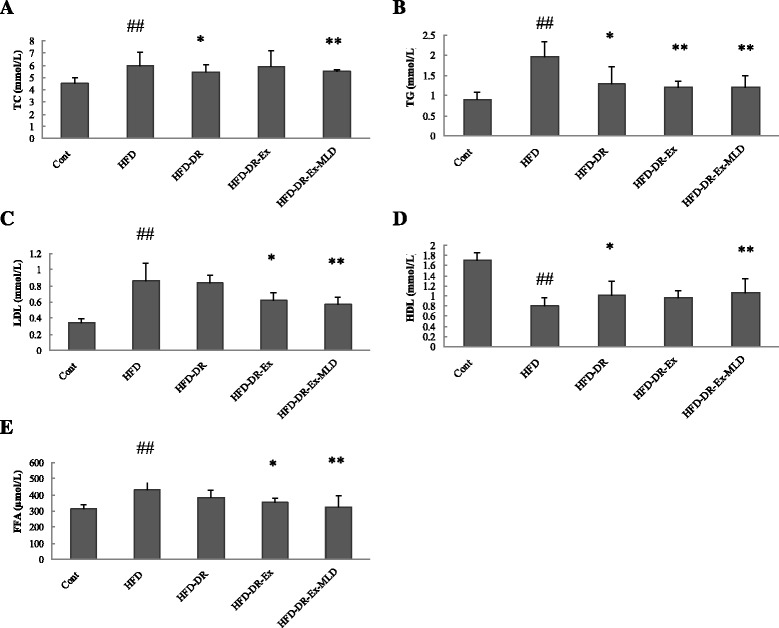
Changes in each group (n = 10) on TC (a), TG (b), LDL (c), HDL (d) and FFA (e). Compared with Control group rats, ## P < 0.01; compared with HFD rats, * P < 0.05, ** P < 0.01, respectively
Official websites use .gov
A
.gov website belongs to an official
government organization in the United States.
Secure .gov websites use HTTPS
A lock (
) or https:// means you've safely
connected to the .gov website. Share sensitive
information only on official, secure websites.
Changes in each group (n = 10) on TC (a), TG (b), LDL (c), HDL (d) and FFA (e). Compared with Control group rats, ## P < 0.01; compared with HFD rats, * P < 0.05, ** P < 0.01, respectively