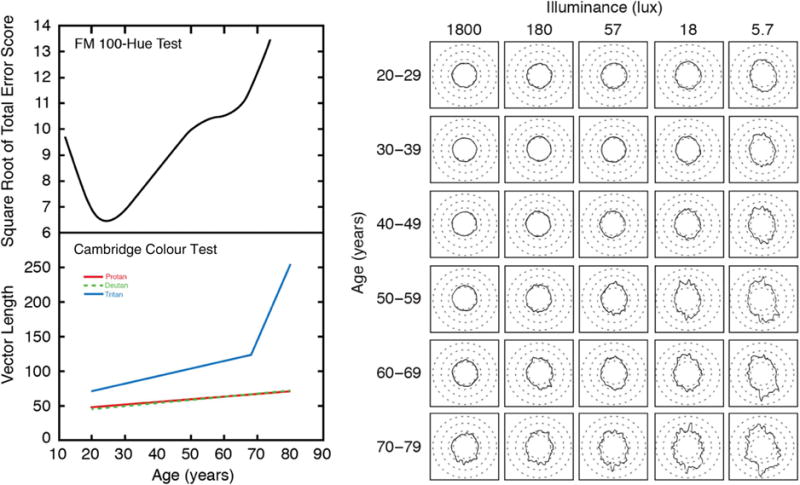
Fig. 1.

Upper left: Famsworth–Munsell 100-Hue error scores (square root of total error score) fitted for 232 participants. Results were obtained from the right eye tested under illuminant C (200 lux). The smooth curve was fitted by local (LOESS) regression; after Verriest et al. [38]. Lower left: Cambridge Colour Test results fitted to data from 168 trichromats; colors (which overlap for deutan and protan) denote different vectors for cone isolation; from Shinomori et al. [42]. Right: Mean FM 100-Hue Test results as a function of illuminance (columns) and age (rows). Cap position 1 is located at the 12:00 position. After Knoblauch et al. [45].
