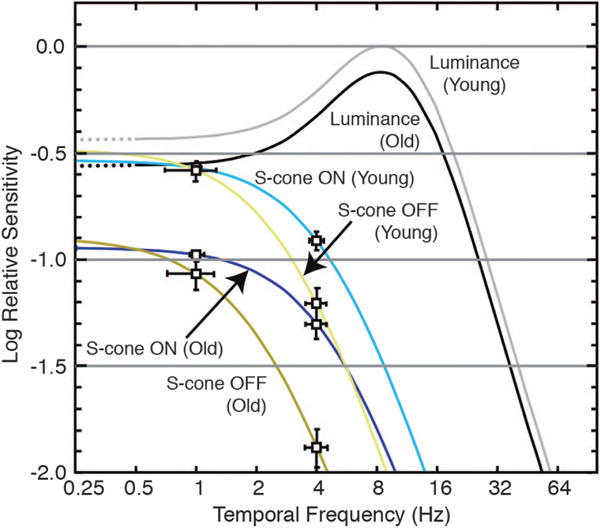
Fig. 12.

Temporal contrast sensitivity derived from the inverse Fourier transform of impulse response functions. Luminance and chromatic modulation were based on the amplitude of the sine wave divided by the mean luminance or chromaticity. Sensitivity of the luminance maximum (young) was normalized to unity, and the minimum sensitivity was taken as −2 log unit, corresponding to flicker modulation from 0.01 to 1 [156]. Error bars denote the possible range of curves based on ±1 SEM. From [142].
