
Fig. 13.
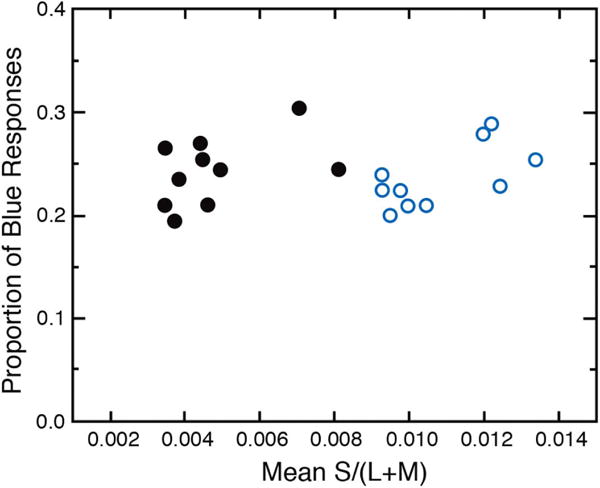
The proportion of “blue” responses to 40 simulated Munsell chips on a CRT is plotted as a function of relative S-cone stimulation. Open and closed symbols represent younger and older groups, respectively. Mean S/(L+M) was calculated from psychophysical measures of ocular media density for each participant. Data from [171].