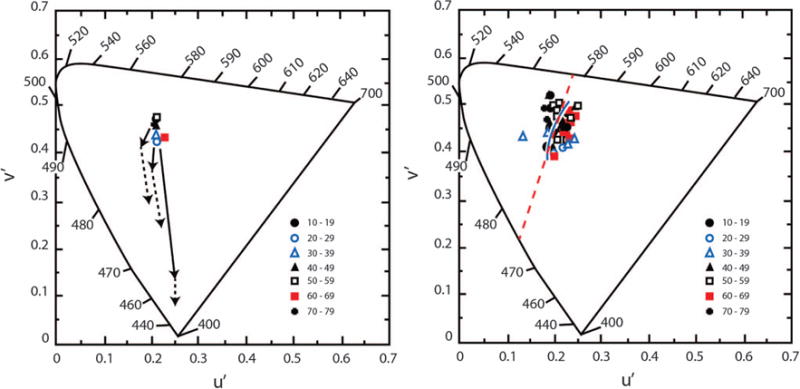
Fig. 14.

Left: The achromatic locus for a theoretical observer is plotted in CIE 1976 u‘v’ chromaticity coordinates calculated for pairs of spectral complementary lights. Predicted shifts in the achromatic locus from age 10 (the central point) to 80 years based on age-related change in ocular media density (solid arrows) and additional age-related losses in S-cone sensitivity of 0.07 log unit/decade (dashed arrows). These shifts were calculated on the basis of transformation equations from receptor space to CIE space [175,180]. The cluster of data points denote the measured achromatic loci (additive mixtures of each observer’s spectral unique blue and yellow) for different age groups indicated by the key. Right: Achromatic loci for individual observers stratified by ages indicated in the key. The solid contour passing through the points represents various phases of daylight illumination [181]. The red dashed line connects 475 and 577 nm, the mean unique blue and yellow for these observers, which is the definition of the Cerulean line [182].
