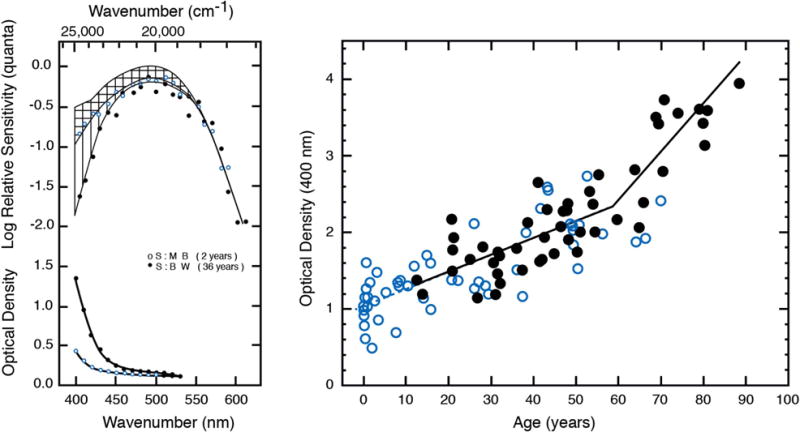
Fig. 2.

Left: The upper curve shows the human rhodopsin absorption spectrum [50], assuming an optical density of 0.25 [51], compared with the scotopic spectral sensitivity of two observers (middle and bottom curves of the top panel). The difference between spectral sensitivity and the rhodopsin absorption spectrum is denoted by horizontal lines for the child and vertical lines for the adult, and plotted in the bottom panel. These curves represent the ocular media density spectrum (from [52]). Right: Ocular media density based on scotopic sensitivity measured with visually evoked cortical potentials (open circles [52]) and psychophysics (filled circles [53]). The bold bilinear function fitted to the data is taken from the model of Pokorny et al. [54]; the dashed line is extrapolated from the lower branch of the bilinear function for ages 0 to 20 years.
