
Fig. 3.
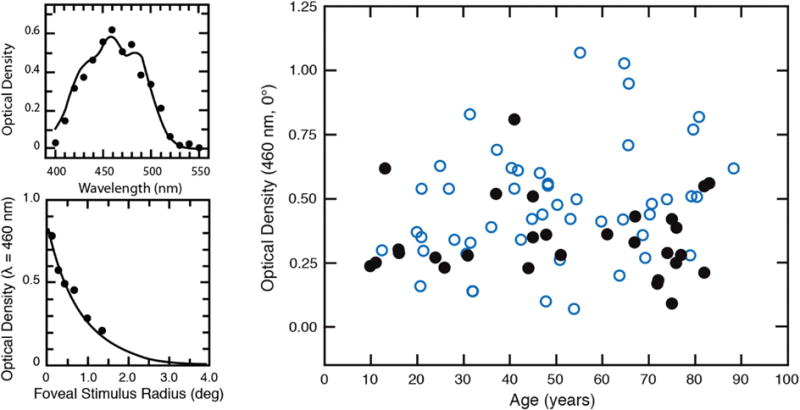
Top left: Data points show the difference spectrum for sensitivity measured foveally and parafoveally under conditions described in the text. The smooth curve is the MP density spectrum from Wyszecki and Stiles [68] adjusted by a scalar for comparison with the data points. Bottom left: Density of the MP plotted as a function of retinal eccentricity fitted with an exponential function. Right: Optical density of MP plotted as a function of age from two studies indicated by different (overlapping) symbols. All data from [53,69].