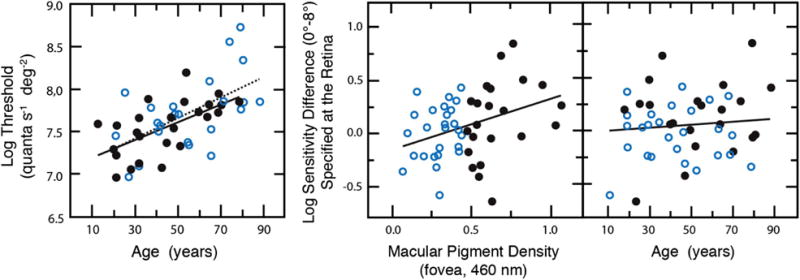
Fig. 8.

Left panel shows log sensitivity at the fovea for detection by S cones measured on the plateau of individual tvr functions. Filled and unfilled symbols, and solid and dashed lines, represent linear regressions for low- and high-peak MP groups, respectively. Center and right panels show S-cone log sensitivity differences (0°–8°) plotted as a function of foveal MP density or age. Open and closed symbols as in left panel. From [53].
