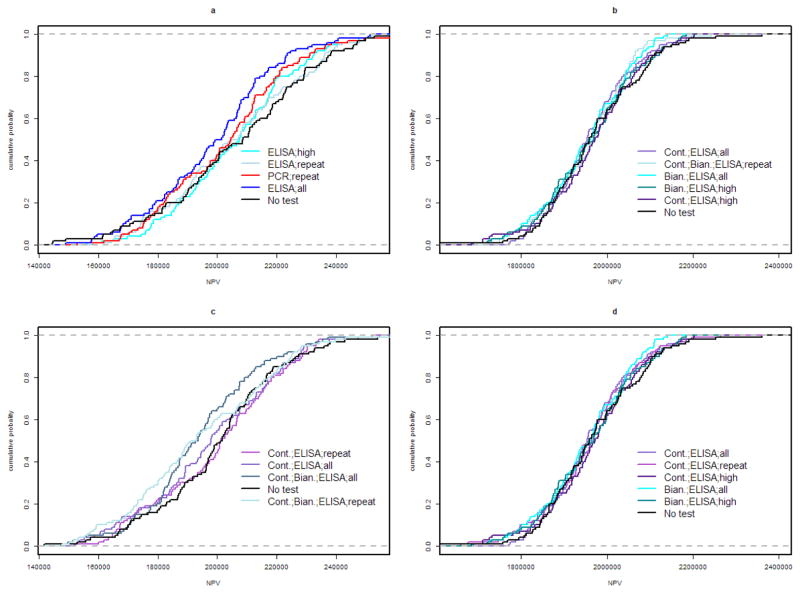
Figure 2.
Cumulative distribution function of net present value (NPV) over 25 years in a herd endemically infected with Mycobacterium avium subsp. paratuberculosis, for the top 5 control programs and doing nothing under each herd scenario (a: 100 head, 10% initial shedding prevalence; b: 1,000 head, 10% initial shedding prevalence; c: 100 head, 20% initial shedding prevalence; d: 1,000 head, 20% initial shedding prevalence).

