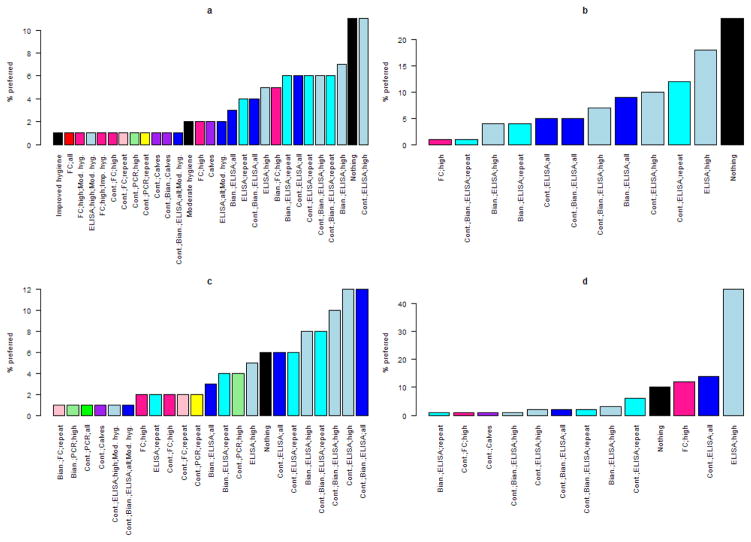
Figure 4.
Probability that one iteration of the simulation preferred a strategy for maximizing net present value while controlling Mycobacterium avium subsp. paratuberculosis in a dairy herd, given the same initial population distribution, for each herd scenario (a: 100 head, 10% initial shedding prevalence; b: 1,000 head, 10% initial shedding prevalence; c: 100 head, 20% initial shedding prevalence; d: 1,000 head, 20% initial shedding prevalence). Black colors indicate no testing; shades of blue are different ELISA-based control methods; shades of red are different fecal culture-based control methods; shades of green and yellow are different PCR-based control methods.

