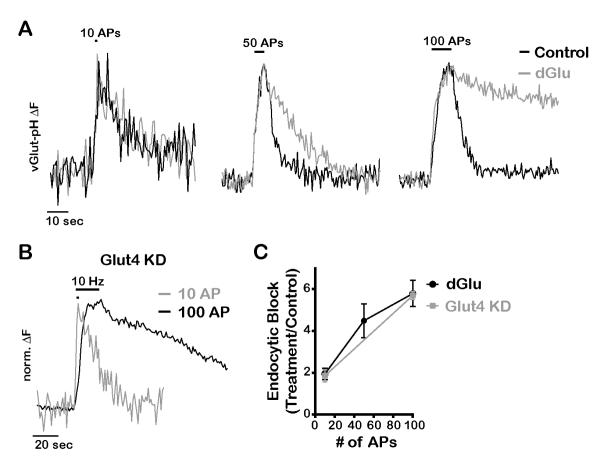
Figure 6. Energetic requirement for glycolysis and glucose uptake increases with duration of activity.
(A) Normalized vGlut-pH traces in response to 10, 50 and 100 AP (10Hz) before and 5 min after incubation with dGlu. (B) Normalized vGlut-pH traces of Glut4 KD neurons stimulated with 10 or 100 AP (10 Hz). (C) Average endocytic block for varying AP trains measured as the fraction of the maximal fluorescence remaining after 2 endocytic time constants in treated (dGlu or Glut4 KD) compared to control conditions, n = 4-21 cells per condition. All error bars are SEM.

