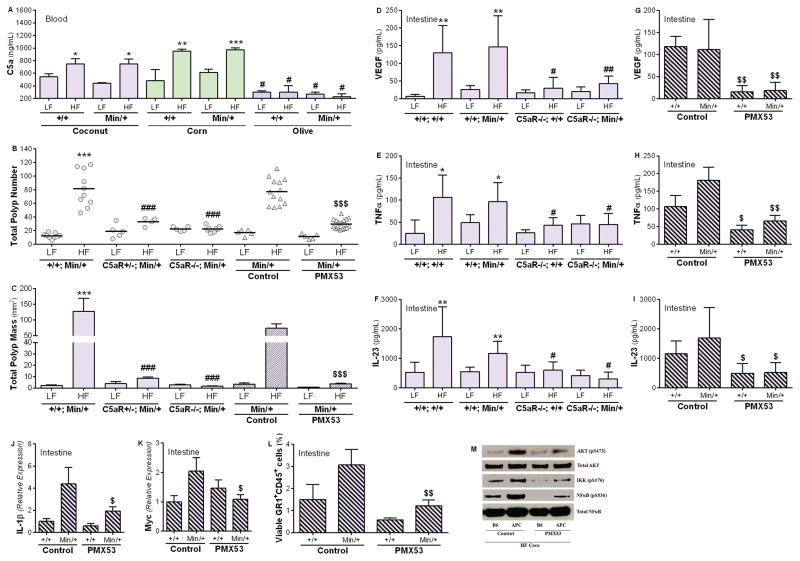
Figure 6. Complement C5a mediates diet-induced inflammation and intestinal neoplasia.
B6.Apc+/+ and B6.ApcMin/+ mice were fed the LFD or HFD with coconut (purple), corn (green), or olive oil (blue) as a source of fat for 30 days. Circulating levels of the complement activation fragment C5a were measured in the plasma at Day 30 of treatment (A). (B–F) B6.ApcMin/+ (+/+; Min/+) and the complement-deficient C5aR+/−; ApcMin/+ (C5aR+/−; Min/+), and C5aR−/−; ApcMin/+ (C5aR−/−; Min/+) strains were fed HFDCoco or LFDCoco for 30 days. The total number of polyps (B) and polyp mass (C) were measured in the intestine of each mouse at Day 30 of treatment. (n=5–20/group). Intestinal inflammation was measured in mice genetically deficient in C5aR (D–F). Protein levels of VEGF (D), TNFα (E), and IL-23 (F) were measured in the intestine (n=3–5/group) B6.Apc+/+ and B6.ApcMin/+ mice were fed HFDCoco for 30 days, and concomitantly treated with the C5aR antagonist peptide (PMX53) or a scrambled inactive peptide (control) (2 mg/kg s.c.) every other day (B, C). (D, E) Intestinal inflammation was measured in males treated with PMX53 or control inhibitor (n=3–5). Total polyp number (B) and polyp mass (C) were measured. Protein levels of VEGF (G), TNF-α (H), and IL-23 (I) and expression of IL-1β (J) and Myc (K) were measured in the intestine of males treated with PMX53 or the control inhibitor (n=3–6/group). (L) The percentage of viable CD11b+/GR-1+ neutrophils was measured with flow cytometry in the intestinal lamina propria of B6.Apc+/+ and B6.ApcMin/+ males treated with PMX53 or the control peptide (n=4/group). Levels of phosphorylated AKT (pS473), IKK (pS176) and NFκB (pS536) were assessed with Western blotting (M) in polyp tissue of B6.ApcMin/+ males or normal intestinal tissue of B6.Apc+/+ males treated with PMX53 or the control peptide. Levels of AKT and NFκB were measured as a control for the protein amount loaded. Results are representative of 3 independent experiments. *P<0.05, **P<0.01, ***P<0.001 compared to same strain fed corresponding LFD. #P<0.05, ##P<0.01, ###P<0.001 compared to B6.Apc+/+ or B6.ApcMin/+ fed the same diet. $P<0.05, $$P<0.01, $$$P<0.001 compared to same strain treated with the control inhibitor.

