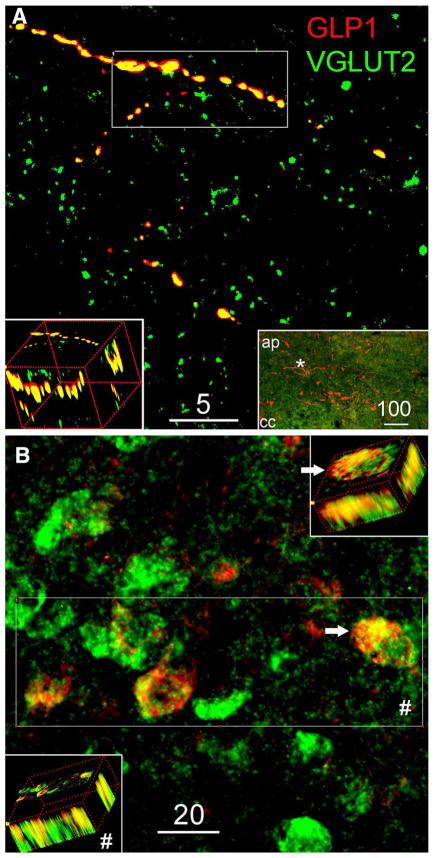
Fig. 4.
Representative confocal images of GLP1 and VGLUT2 in the NST. a 5-μm-thick projection image demonstrates the colocalization of GLP1-ir and VGLUT2-ir; 3D rotated insert shows the maximum intensity projection from region of interest. Inserted low magnification (×10) epifluorescence image indicates the distribution of GLP1-ir cell bodies and terminals in the NST and the region (hash) where the confocal image was taken. b 6-μm-thick projection image from combined ISH and IHC labeling demonstrates the localization of GLP1-ir in VLGUT2 mRNA expressing neurons. Hash, 3D rotated insert shows GLP1-ir in all four VGLUT2 mRNA expressing neurons from the area of interest. White arrow provides a detail 3D view from one double-labeled neuron

