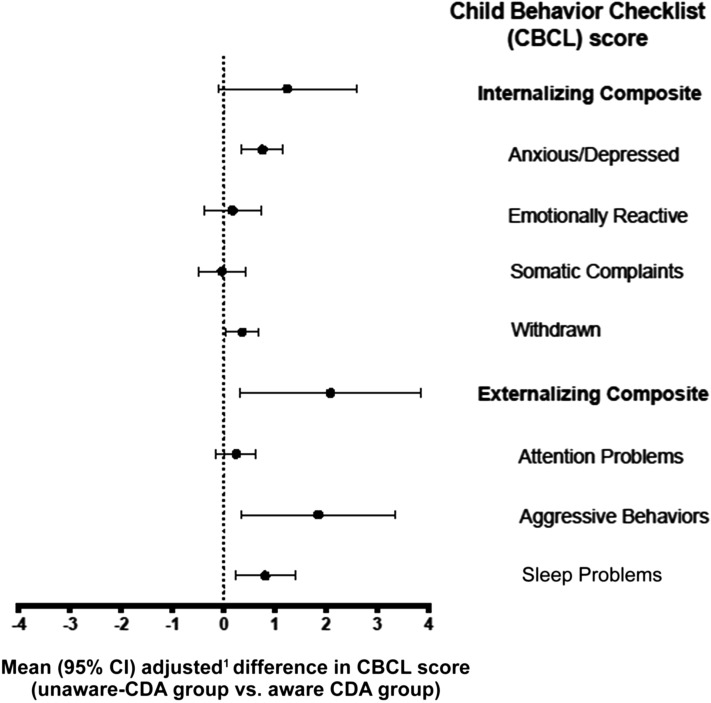
FIGURE 1.
Difference in CBCL scores between the unaware-CDA group and aware-CDA group. Positive values indicate that the unaware-CDA group had higher CBCL scores. 1Difference in CBCL score was adjusted for country of birth, HLA antigen risk group, sex, FDR with celiac disease, and maternal age at birth.

