
Figure 5.
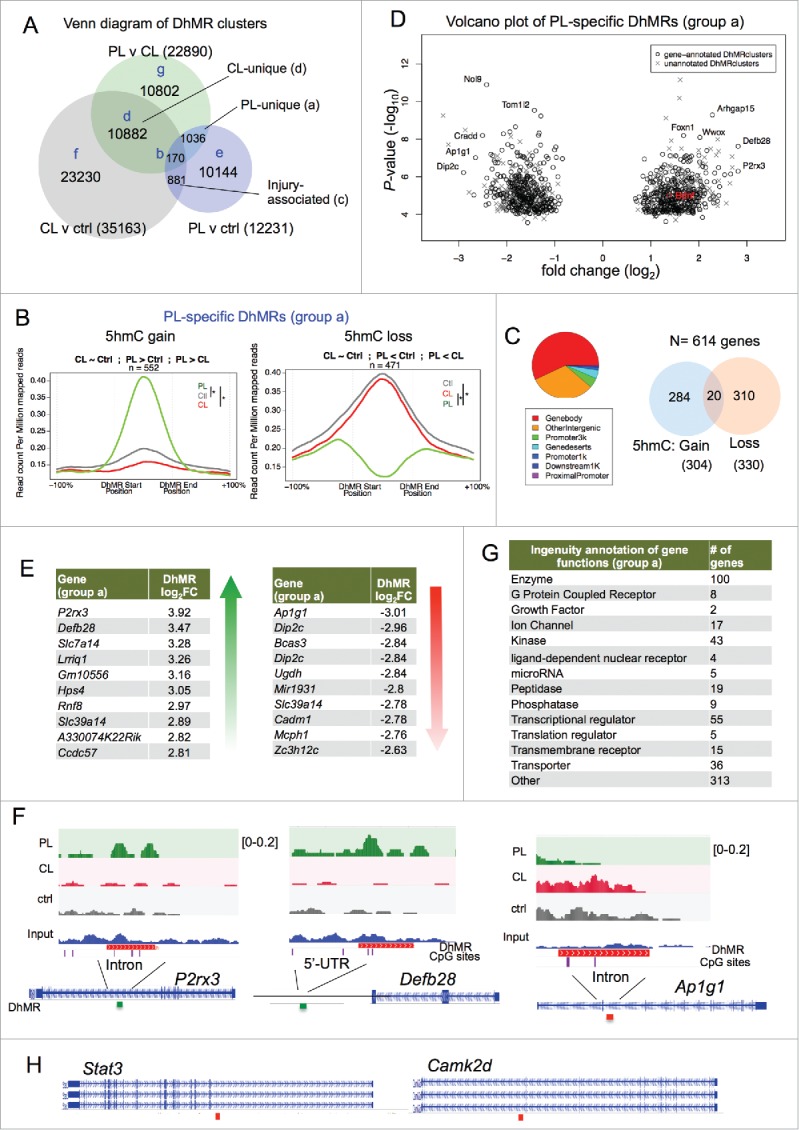
Conditioning lesion-specific DhMRs (A) Venn diagram of three sets of DhMRs from pairwise comparisons identifying DhMR clusters that were unique to PL or CL, as well as injury-associated DhMRs that were shared by both. (B) PL-specific (group a) DhMRs separated into the group with specific 5hmC gain (left) and the group with specific 5hmC loss (right). Normalized 5hmC signals (reads per million divided by bin size) were plotted continuously upstream, within, and downstream of each PL-specific DhMRs and averaged across these regions. Total number of DhMRs is indicated at the top. (C) Pie chart showing the association of group a DhMRs with genomic features (left). The numbers of genes associated with group a DhMRs (5hmC gain or loss) are shown on the right. (D) Volcano plot of PL-specific DhMRs according to 5hmC fold changes and P-values. The location of Bdnf is highlighted in red. (E) Top ranked group a DhMRs with the largest fold change (FC) of either 5hmC gain or loss. (F) Genomic views of top ranked PL-specific DhMRs, exhibiting unique gain (P2rx3 and Defb28) or loss (Ap1g1) of 5hmC after PL compared with CL or control. (G) Ingenuity annotations of gene functions of group a DhMR-associated genes. (H) Genomic views of Stat3 and Camk2d showing locations of DhMRs. See also Figs. S2-S5.