Figure 3.

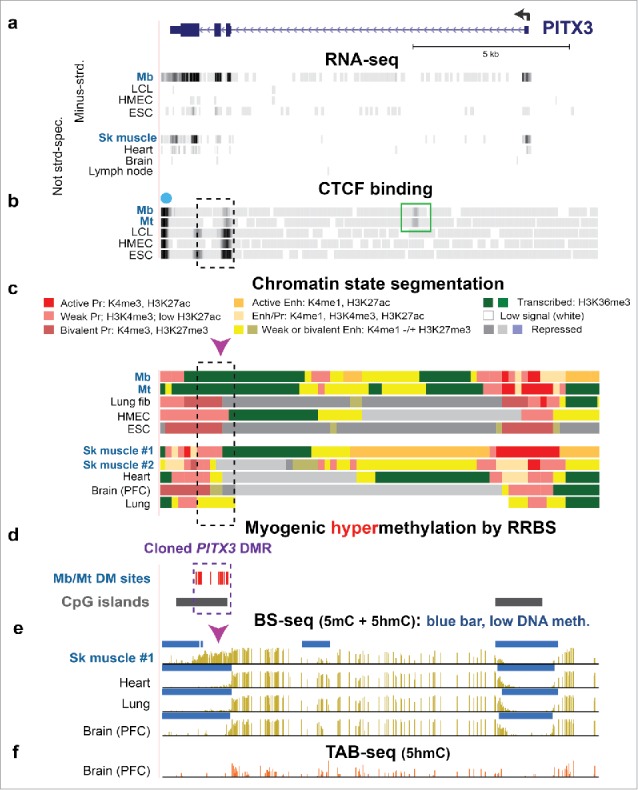
Intragenic Mb/Mt DNA hypermethylation, decreased CTCF binding, and loss of poised promoter chromatin in PITX3 correlated with gene expression in Mb and Mt. (a) RefSeq gene structure for PITX3, a developmental gene, at chr10:103,989,638–104,003,464 (all coordinates for figures are in hg19 and all tracks are aligned) and ENCODE RNA-seq data. The sequence-specific minus-strand RNA-seq profile is shown for cell cultures and the not strand-specific RNA-seq data for tissues.37 (b) CTCF binding from ENCODE data (dot, predicted insulator; green box, preferential Mb/Mt CTCF binding site. (c) Chromatin state segmentation from RoadMap data37 with the indicated color code; Pr, promoter; Enh, enhancer; Enh/Pr, both active promoter-type and enhancer-type histone modification; Repressed, enriched in H3K27me3 (weak, light gray; strong, dark gray) or H3K9me3 (violet). (d) Statistically significant hypermethylated sites as determined by RRBS for comparison of the set of Mb and Mt vs. 16 types of non-muscle cell cultures23 and CGIs from the UCSC Genome Browser.37 (e) Bisulfite-seq profiles37 with blue bars indicating regions with significantly lower methylation compared with most of the given genome.28,72 (f) TAB-seq profile of the distribution of 5hmC in the same prefrontal cortex (PFC) DNA sample from brain used for bisulfite-seq. Mb, myoblasts; LCL, GM12868 lymphoblastoid cell line; HMEC, human mammary epithelial cells; ESC, H1 embryonic stem cells; Sk muscle #1, psoas muscle; Sk muscle #2, unknown type of skeletal muscle; Lung fib, IMR-90, fetal lung fibroblast cell line; heart, left ventricle. Dashed box, cloned DMR sequences; arrowhead, Epimark-assayed CCGG, which had high 5hmC in SkM (Fig. 2a).
