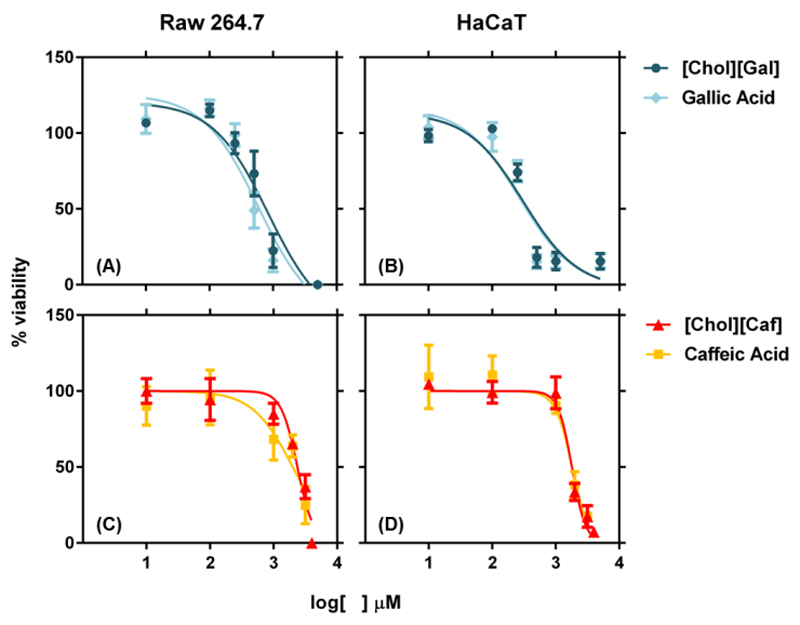
Figure 3.
Viability of Raw 264.7 and HaCaT cells assessed as the normalized response of treated cells to untreated controls, measured by the metabolic conversion of resazurin. The data shown represents the dose-response curves of Raw 264.7 cells to: (A) [Chol][Gal] EC50: 835.8 µM and Gallic Acid EC50: 590.7 µM; and (C) [Chol][Caf] EC50: 2336 µM and Caffeic Acid EC50: 1996 µM; and HaCaT cells to (B) [Chol][Gal] EC50: 303.5 µM and Gallic Acid EC50: 267.1 µM; and (D) [Chol][Caf] EC50: 1794 µM and Caffeic Acid EC50: 1803 µM.

