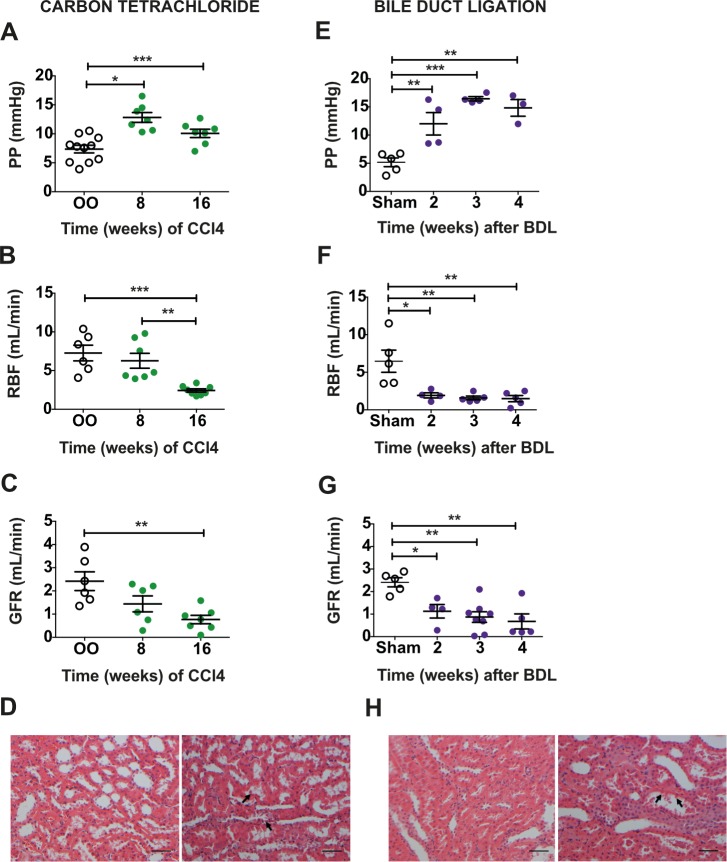
Fig 1. Rat models of advanced cirrhosis, portal hypertension, and renal dysfunction.
Portal pressure (PP; A), renal blood flow (RBF; B), and glomerular filtration rate (GFR; C) in 16-wk CCl4 and olive oil (OO) control rats (n = 6–11). Representative H&E-stained kidney (scale bar 50 μm) showing minor tubular epithelial cell vacuolation (arrows) without significant necrosis after 16 wk of CCl4 (D). PP (E), RBF (F), and GFR (G) in bile duct ligation (BDL) and sham-operated (sham) control rats (n = 4–8). Representative H&E-stained kidney (scale bar 50 μm) showing necrotic cells within the tubule lumen and loss of the normal circumferential epithelial cell population (arrows) 4 wk after BDL (H). Data presented as mean ± standard error of the mean, analyzed by one-way ANOVA with post hoc Bonferroni correction (*p < 0.05; **p < 0.01; ***p < 0.001).

