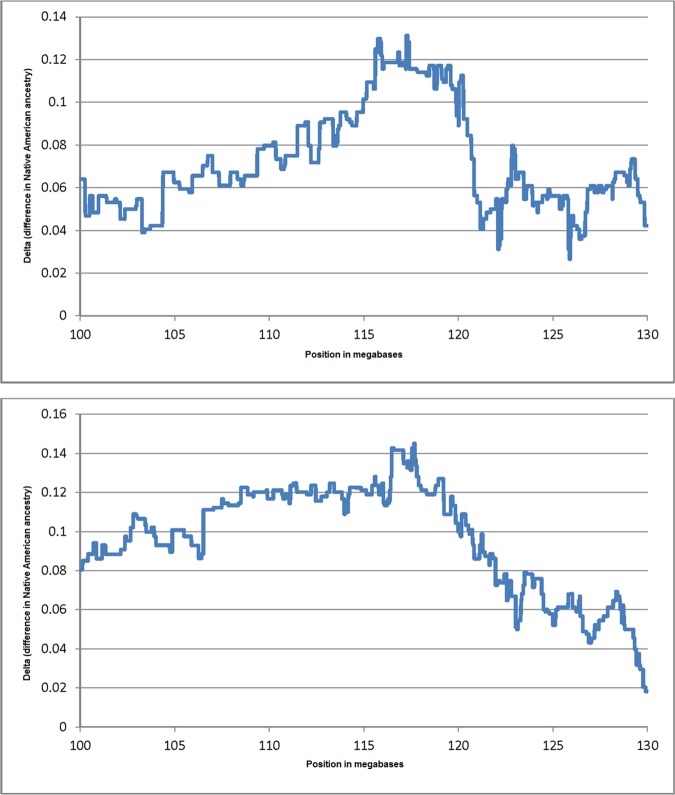
Fig 1. Plots showing the difference in Native American ancestry proportions between the individuals in the highest quartile of TG concentrations and individuals in the lowest quartile of TG concentrations.
The plots show the differences observed for the region on chromosome 11 spanning from 100 Megabases to 130 Megabases. A/ Mexico City sample 1, B/ Mexico City sample 2.

