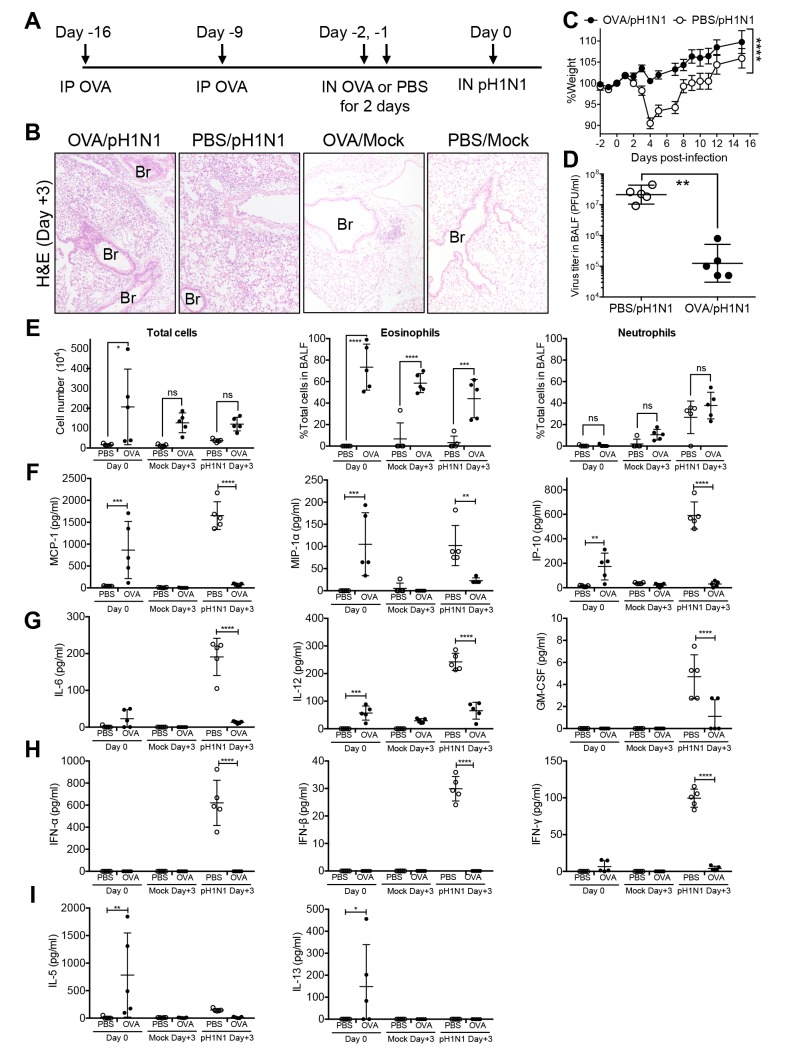
Fig 3. Influenza virus infection of OVA-challenged NC/Nga mice with pre-existing acute allergic airway inflammation.
(A) Schematic showing OVA sensitization, OVA-induced allergic airway inflammation, and influenza virus infection. NC/Nga mice were sensitized twice (via the IP route) with OVA (Day -16 and Day -9) and then subsequently challenged IN with OVA on two consecutive days (Day -2 and Day -1). On the day following the final OVA challenge (Day 0), the mice were inoculated IN with a sublethal dose of influenza virus A/H1N1pdm09 (pH1N1). (B) Representative lung tissue sections from OVA/pH1N1, PBS/pH1N1, OVA/Mock, and PBS/Mock mice on Day 3 post-infection (3 mice/group). Hematoxylin and eosin (H&E) staining. Original magnification: ×10. (C) Weight loss was monitored after infection (10 mice/group). Error bars represent the mean ± SEM. Weight change data were combined from two independent experiments. (D) On Day 3 post-infection, virus titers in the BALF were measured in a plaque assay (5 mice/group). Data are expressed as scatter plots with the mean viral titer ± SD. (E) Total cell counts and the proportion of inflammatory cells in the BALF assessed on Day 0 and Day 3 post-infection (5 mice/group). Data are expressed as scatter plots with the mean ± SD. (F to I) Concentrations of chemokines and cytokines, and interferons in BALF from influenza virus-infected mice with pre-existing allergic airway inflammation. The concentrations of chemokines (F), proinflammatory cytokines (G), interferons (H), Th2 cytokines (I) in BALF from PBS/Mock, OVA/Mock, PBS/pH1N1 and OVA/pH1N1 mice were measured before (Day 0) and after (Day 3) infection (5 mice/group). Data are expressed as scatter plots with the mean ± SD. *p<0.05, **p<0.01, ***p<0.001, and ****p<0.0001 (two-way ANOVA or Mann-Whitney U test). Br, Bronchiole. The experiments were repeated independently at least twice.

