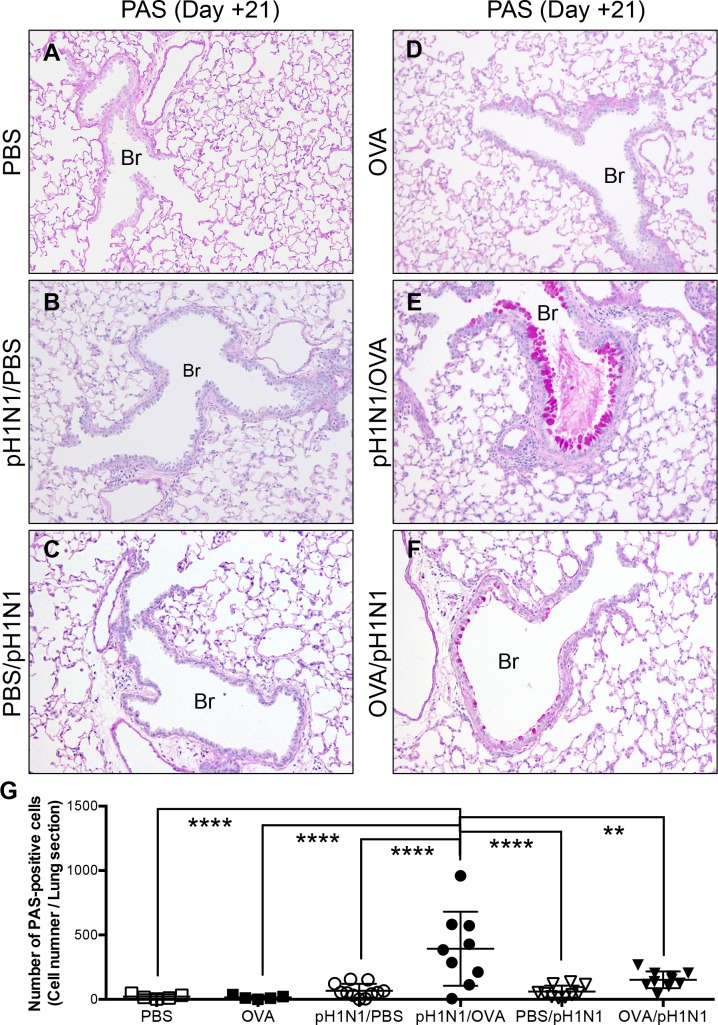
Fig 5. Histopathological analysis for bronchiolar epithelial goblet cell metaplasia at Day 21 post-infection.
Representative PAS-stained sections of lung tissues from (A) control mice (inoculated with PBS alone), (B) mice inoculated with influenza virus followed by PBS (pH1N1/PBS), (C) mice inoculated with PBS followed by influenza viral infection (PBS/pH1N1), (D) mice challenged with OVA but not infected with influenza virus (OVA), (E) mice infected with influenza virus followed by OVA challenge (pH1N1/OVA), and (F) mice challenged with OVA and then infected with influenza virus (OVA/pH1N1). The data are representative of 5 to 11 mice/group from three independent experiments. Original magnification: 20×. Br, Bronchiole. (G) Numbers of PAS positive epithelial cells in lung tissues from PBS, OVA, pH1N1/PBS, pH1N1/OVA, PBS/pH1N1, and OVA/pH1N1 were obtained by visual estimation over the entire area of the section. The data are expressed as scatter plots with the mean ± SD of results for 5 to 11 mice/group from three independent experiments. **p<0.01, and ****p<0.0001 (one-way ANOVA).

