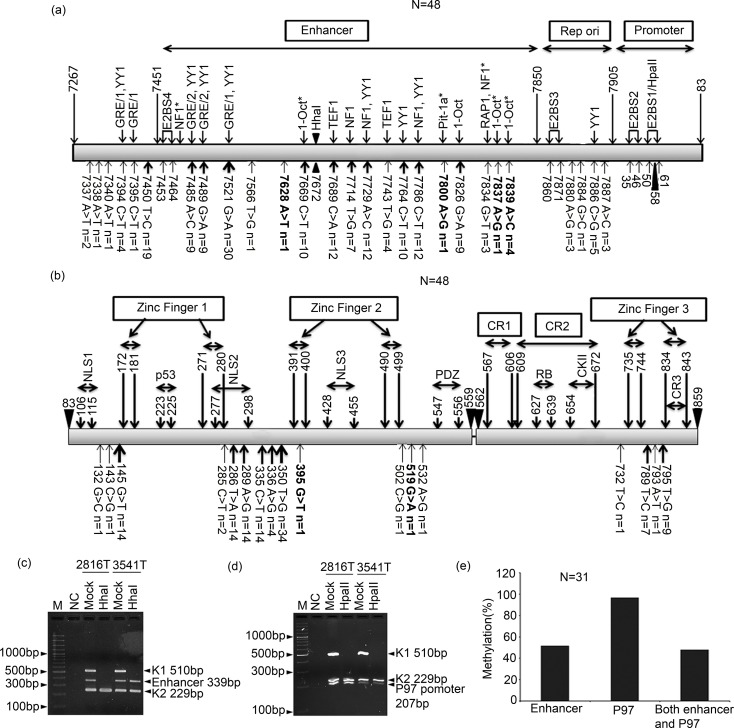
Fig 4. Sequence variation of LCR, E6 and E7 region and methylation status of LCR of HPV16 in pre-therapeutic breast tumor cases.
Schematic representation of identified sequence variations in (a) the LCR region and (b) the E6 and E7 gene. Here, bold lettered variants were novel ones. Upper head arrow thickness indicate the frequency of the given variation where “N” represent number of samples. In LCR, lower head arrows indicates binding of the transcription factors while in E6 and E7 gene it highlighted different protein domains. Methylation sites in the LCR were also marked (Bold triangle). ‘*’ indicates transcription factors predicted by Alibaba 2.1 TF Binding Prediction software. Representative agarose gel showing methylation status at (c) the enhancer region (d) the P97 promoter region. (e) Histogram showed significant high frequency methylation in P97 promoter than enhancer region (p = 0.004). [M: 1000bp marker, NC represent Negative control with no DNA, K1 used as digestion control, K2 used as DNA integrity control, Mock: mock digestion without enzyme, HhaI: DNA digested with HhaI enzyme, HapII: DNA digested with HpaII enzyme].

