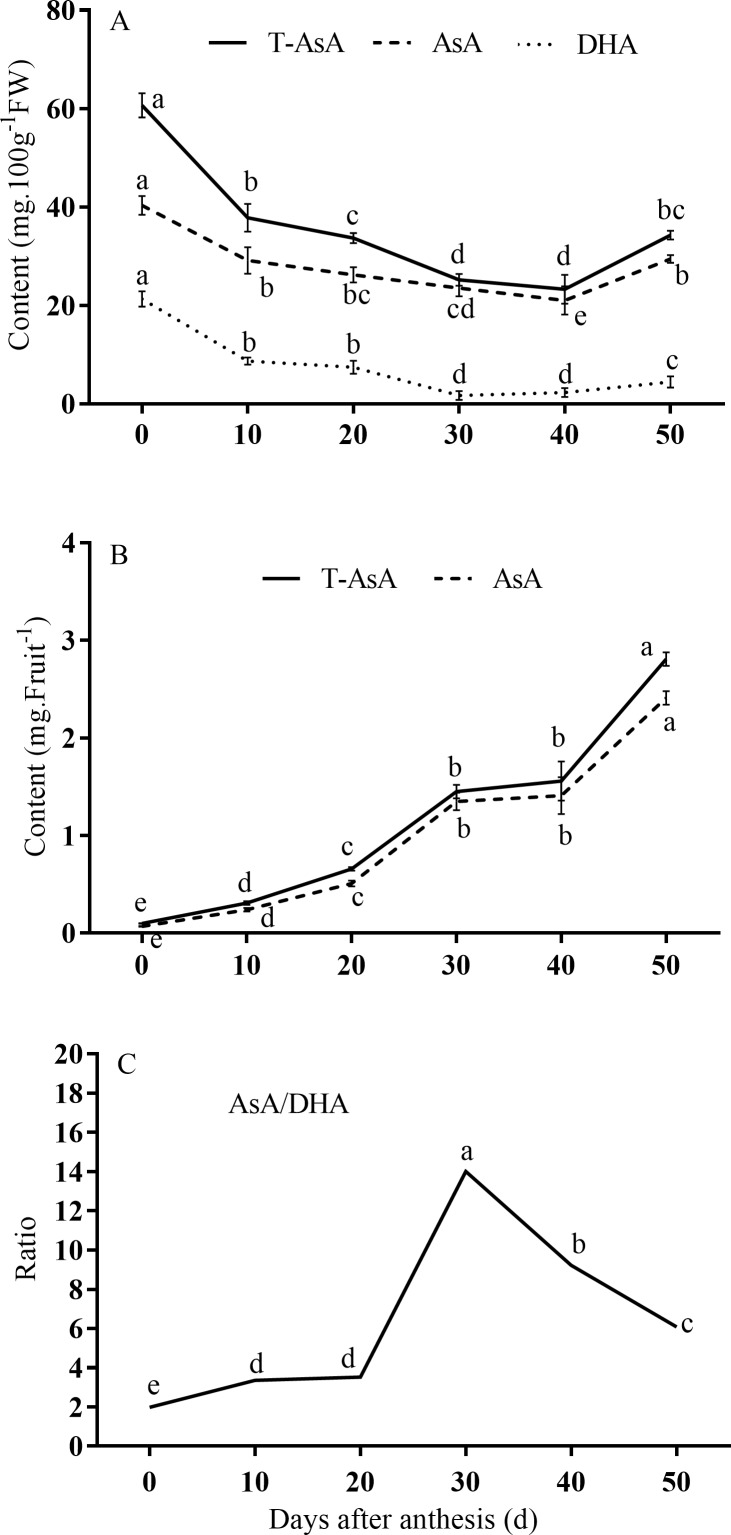
Fig 2. Changes in ascorbic acid (AsA) accumulation levels during fruit development.
(A) Total AsA (T-AsA), AsA, and dehydroascorbate (DHA) concentrations based on fresh weight of fruit; (B) T-AsA and AsA content per fruit; (C) AsA/DHA ratio. T-AsA and AsA content per fruit was obtained by multiplying average fruit weight by concentration based on fresh weight.

