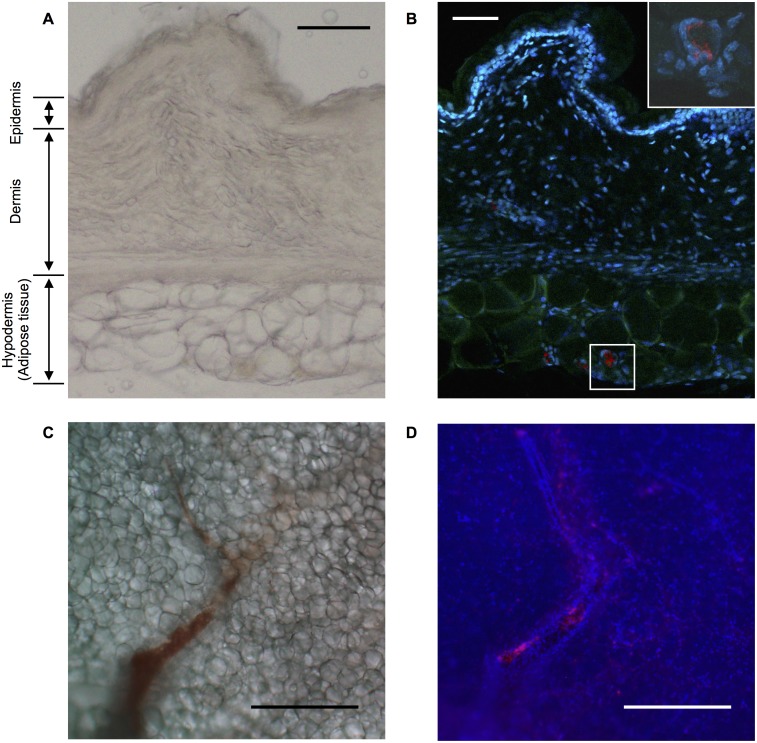
Fig 3. Leptospira distribution in skin and subcutaneous tissue.
Representative light field (A, C) and fluorescence images (B, D) of the skin and subcutaneous tissue (A, B) or adipose tissue (C, D) around the injection sites of M1307 collected from infected hamsters at phase 4. Fluorescence images (B, D) showing cell nuclei stained with DAPI (blue), autofluorescence of the skin and subcutaneous tissue (green, not shown in panel D), and leptospires stained with rabbit polyclonal antiserum and Cy5-conjugated anti-rabbit monoclonal antibody (red). The framed area in (B) is enlarged at the upper right. Scale bars: 100 μm (A, B), 500 μm (C, D).

