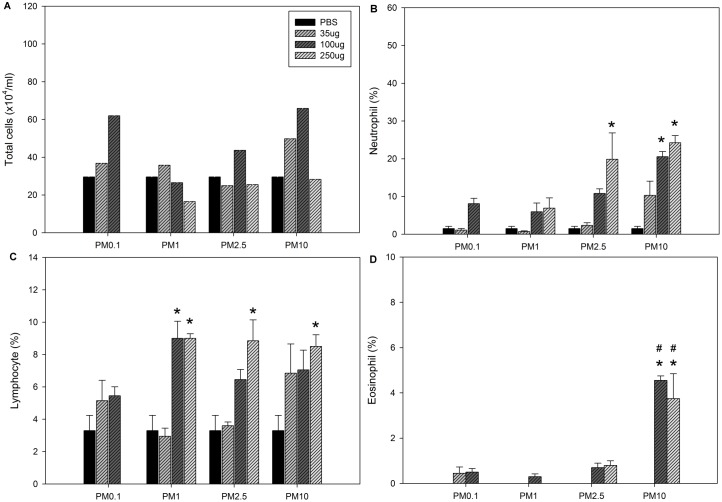
Fig 2. Inflammatory cell profiles in BALF following the 2nd exposure to PM.
A: Total cells. B: Neutrophils. C: Lymphocytes. D: Eosinophils. The mice were exposed to 100 μL aliquots of solutions by intratracheal instillation on days 0 and 7 as described in the Materials and Methods section. The data are presented as the mean ± SEM (n = 5 per treatment group). Neutrophil, lymphocyte and eosinophil counts are expressed as percentages of total cell counts. *p<0.05 compared to the PBS group; #p<0.05 compared to the other groups at the same dose.

