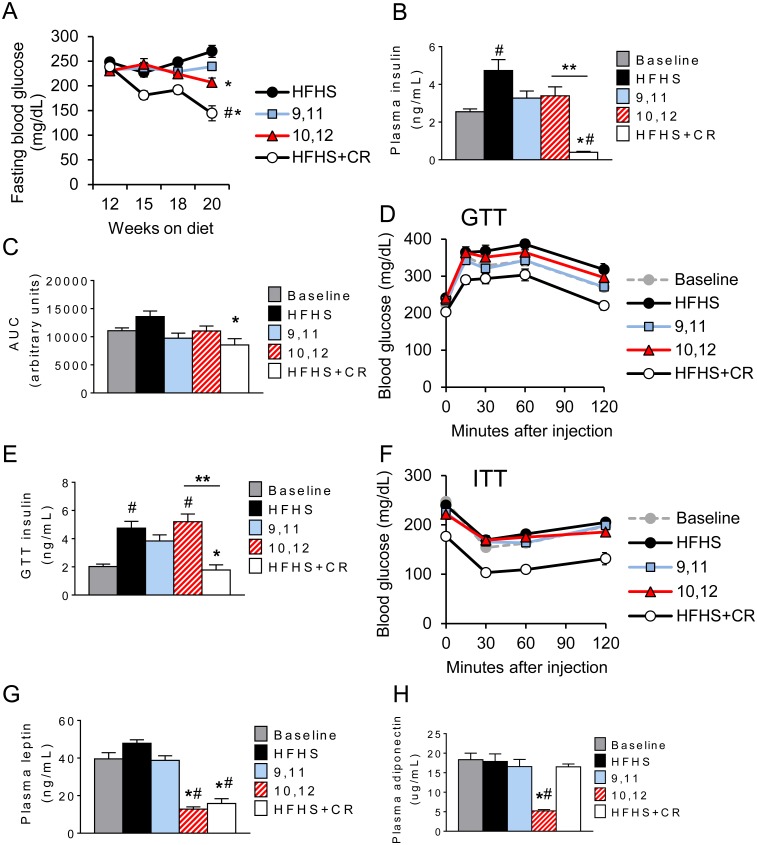
Fig 3. 10,12 CLA fails to improve glucose metabolism.
A. Fasting blood glucose taken at indicated time points. B. Fasting plasma insulin measured at sacrifice. C-D. Area under the curve (AUC, C) for glucose tolerance test (GTT, D) performed at 10 weeks (baseline) and 12+6 weeks on HFHS+indicated diets. E. Plasma insulin measured at the 30 minute time point during the GTT. F. Insulin tolerance test (ITT) performed at 11 weeks (baseline) and 12+7 weeks on the indicated diets. G-H. Fasting plasma leptin (G) and adiponectin (H) measured at baseline and sacrifice. Data are presented as mean ± SEM, n = 10-15/group. #P<0.05 from baseline, *P<0.05 from HFHS control, **P<0.05 from CR.

