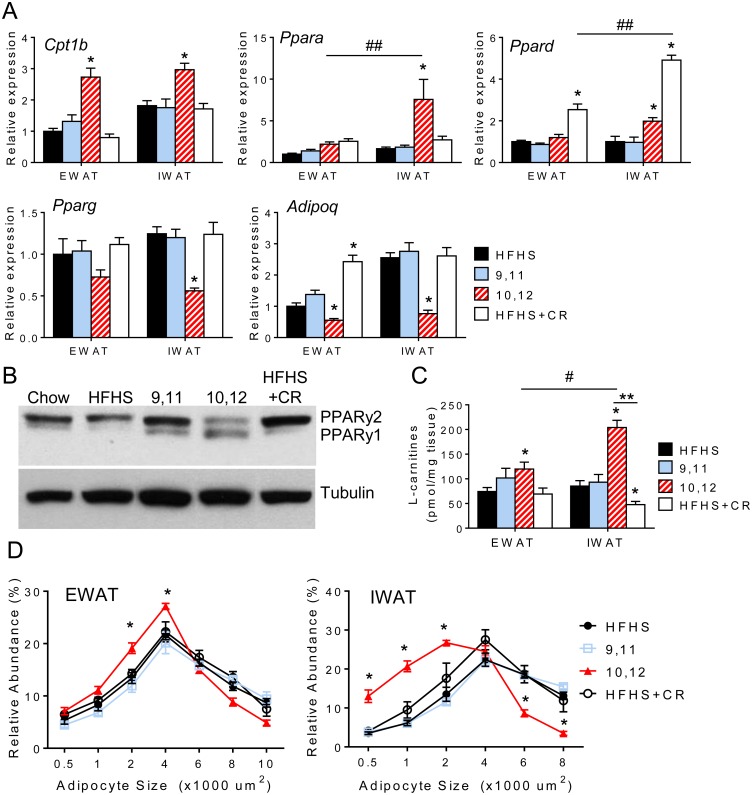
Fig 5. Differential expression of lipid metabolism genes in visceral and subcutaneous depots in response to 10,12 CLA and caloric restriction.
A. Expression of lipid catabolism genes (Cpt1b, Ppara, Ppard) and adipogenic genes (Pparg and Adipoq) from EWAT and IWAT (normalized to HFHS-fed EWAT). B. Representative Western blot for PPARγ, with tubulin used as a loading control. C. L-carnitine levels in EWAT and IWAT. D. Adipocyte size distribution of EWAT (left) and IWAT (right). Data are presented as mean ± SEM, n = 10-15/group. *P<0.05 from HFHS control, #P<0.05 from EWAT, **P<0.05 from CR.

