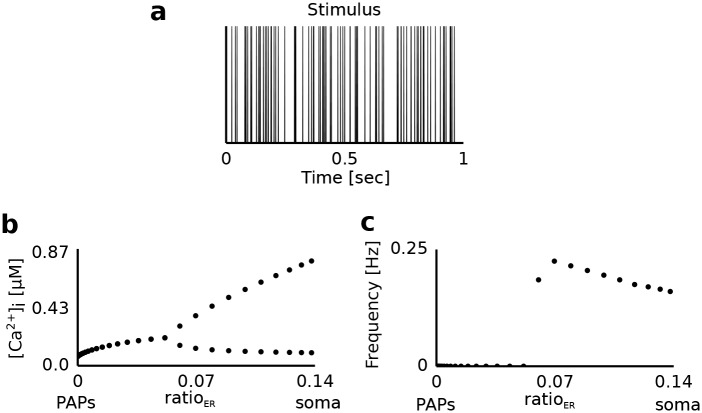
Fig 4. Dynamics of the Ca2+ concentration in the intracellular compartment during synaptic activation.
a Sample stimulus (spikes). The astrocytic compartment was stimulated for 200 seconds with a Poisson spike train of 100 Hz. The corresponding glutamate concentration in the extracellular compartment as a function of time was calculated using the Tsodyks-Markram model. b [Ca2+]i for different values of the volume ratio (ratioER) between the internal Ca2+ store and the intracellular compartments. The upper and lower symbols for ratioER>0.06 denote the average height of peaks and troughs of the emerging Ca2+ oscillations (in [μM]). For ratioER≤0.06 no Ca2+ oscillations were present and symbols denote the average concentration of Ca2+ over the stimulation period. c Frequency of Ca2+ oscillations as a function of ratioER.

