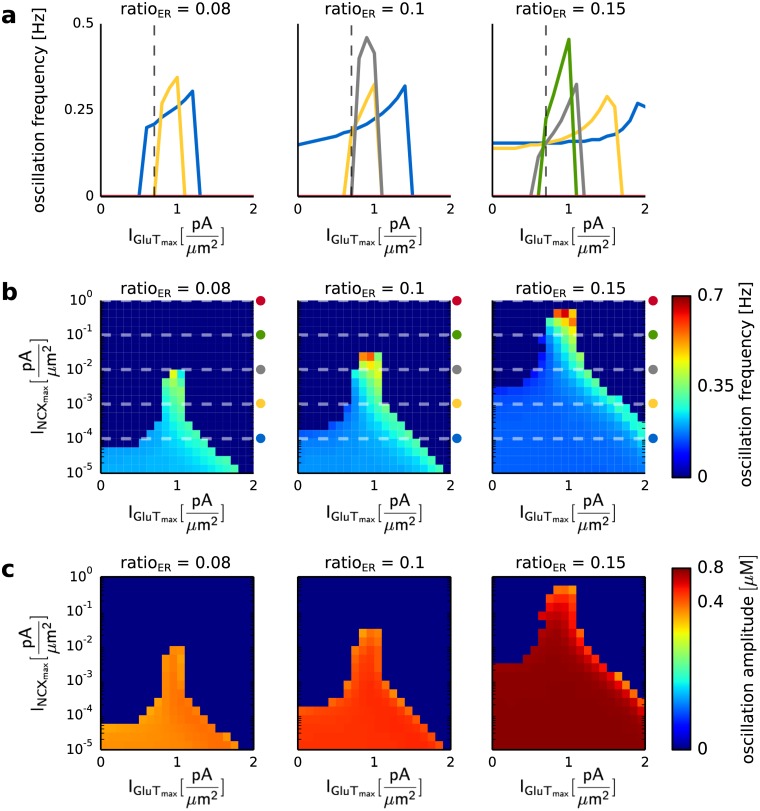
Fig 7. Ca2+ oscillation frequency and amplitude for different values of the volume ratio between the internal Ca2+ store and the intracellular space (ratioER), as well as the maximal pump currents of the Na+/Ca2+ exchanger (INCXmax) and the glutamate transporter (IGluTmax).
The astrocytic compartment was stimulated for 200 seconds with a Poisson spike train of 100 Hz. a Ca2+ oscillation frequency for three different values of ratioER (0.08, 0.1 and 0.15), as a function of IGluTmax and INCXmax. The colored lines correspond to INCXmax equal to 0.0001 (blue), 0.001 (yellow), 0.01 (gray), 0.1 (green) and 1 (red). The dashed line corresponds to IGluTmax equal to 0.68. b Ca2+ oscillation frequencies for three different values of ratioER (0.08 0.1 and 0.15), as a function of IGluTmax and INCXmax. The colored symbols denote the values of INCXmax shown in a. c Ca2+ oscillation amplitudes for four different values of ratioER (0.05, 0.06, 0.1 and 0.15), and as a function of IGluTmax and INCXmax.

