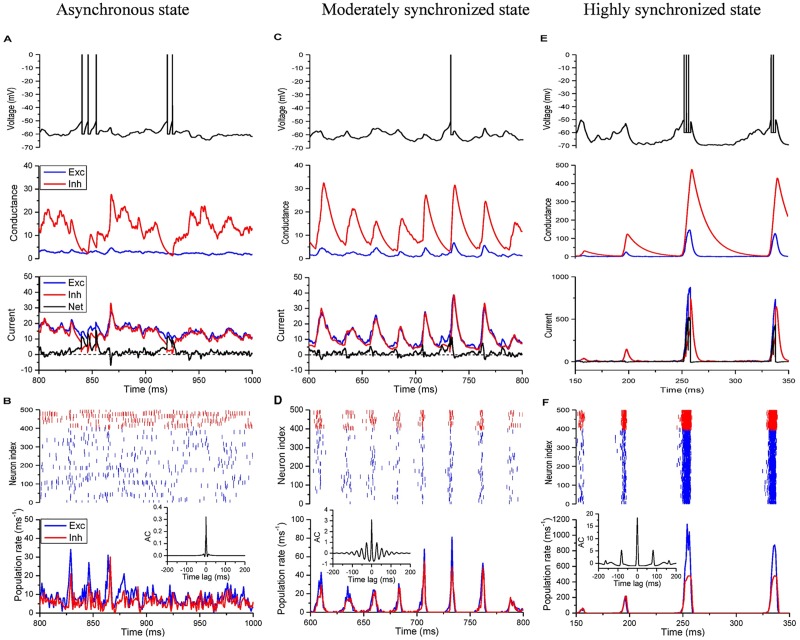
Fig 2. Multi-scale dynamics of E-I balanced network with various synchrony degree.
Left panel: asynchronous state (τd_e = 6 ms, τd_i = 6 ms); Middle panel: moderately synchronized state (τd_e = 4 ms, τd_i = 10 ms); Right panel: highly synchronized state (τd_e = 2 ms, τd_i = 14 ms). (A, C, E) Time series of membrane potential, input conductances, and input currents of a randomly selected neuron. (B, D, F) Network activity. Top, raster plot of a subset 500 neurons (Exc 400 (blue), Inh 100 (red)); bottom, the average excitatory and inhibitory population activity in 1-ms bins; inset, autocorrelation (AC) of the excitatory population activity. Middle and right panels show that the population rhythm is mainly determined by inhibitory decay time τd_i, and the delayed negative feedback from inhibitory population suppresses the firing of the excitatory population, leaving a window for integration, whose size controls the burst of individual activities (C, E).

