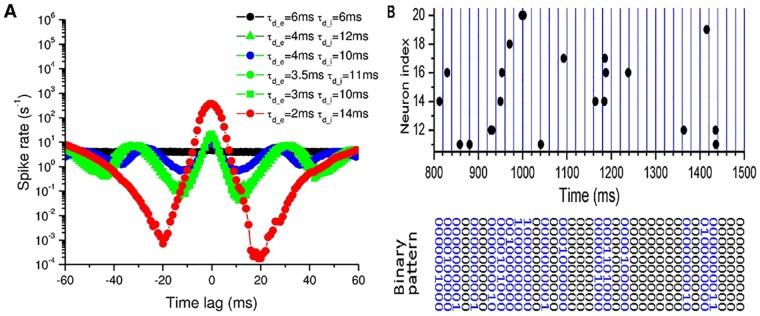
Fig 5. Definition of spatiotemporal spike patterns.
(A) Examples of cross-correlogram between neuron pairs for various parameter sets (τd_e, τd_i) show that spike coincidence happens within 20-ms windows; the average firing rate of one neuron is plotted relative to the time at which the other neuron spikes, averaged over 2000 pairs of randomly selected excitatory neurons. Black, blue, red points are the respective subcritical, critical supercritical cases as exampled in Fig 2. Three more cases around the critical region are shown as green points. (B) Schematics of mapping spiking patterns of 10 randomly selected neurons into binary strings; black, patterns without any spike; blue, binary patterns with spikes.

